Showing MK's Impact Using PIT
Feb 2019 »1. Introduction
The DC government has questioned whether Miriam’s Kitchen (MK) is worth the cost. The government would rather spend 20,000 on private housing as compared to 40,000 for MK initiatives. Using Point in Time data (how many homeless people were on the streets or sheltered at a given point of time) for Federal CoC (Continuum of Care), Federal State, and MK, we can compare how MK does as compared to other homeless efforts in DC.
We’ll be using Federal State, Federal CoC, and MK data. For each, we’ll take the PIT for both sheltered homeless and overall homeless from the years 2007-2018. Since there are vastly more homeless in DC State and DC CoC programs than there are in MK, we’ll instead compare the ratio of sheltered homeless PIT and overall homeless PIT for each of those 3 categories.
2. Load, Clean, and Visualize Data
federal_folder = 'federal_data'
mk_folder = 'mk_data'
federal_coc_pit_file = '2007-2018-PIT-Counts-by-CoC'
federal_state_pit_file = '2007-2018-PIT-Counts-by-State'
mk_pit_file = 'Cumulative_MK_PIT_Cleaned_Results_2007_to_2018'

import pandas as pd
from pandas import Series,DataFrame

federal_coc_pit_excel_file = pd.ExcelFile('../data/' + federal_folder + '/' + federal_coc_pit_file + '.xlsx')
federal_state_pit_excel_file = pd.ExcelFile('../data/' + federal_folder + '/' + federal_state_pit_file + '.xlsx')

mk_pit_excel_file = pd.ExcelFile('../data/' + mk_folder + '/' + mk_pit_file + '.xlsx')

mk_pit_data = pd.read_excel(mk_pit_excel_file, 'Sheet2')
mk_pit_data = {str(key).replace(' ', ''): val
     for key, val in mk_pit_data.items()}

state_key = 7
coc_key = 68

ratio_th_dict = {}

ratio = lambda subset,total: subset/total

for mk_key in mk_pit_data.keys():
    if 'Unnamed' not in str(mk_key):

        federal_state_pit_data = pd.read_excel(federal_state_pit_excel_file, str(mk_key))
        federal_coc_pit_data = pd.read_excel(federal_coc_pit_excel_file, str(mk_key))

        ratio_th_dict[mk_key] = {}

        ratio_th_dict[mk_key]['Federal State PIT'] = ratio(federal_state_pit_data['Sheltered TH Homeless, ' + str(mk_key)][state_key], federal_state_pit_data['Overall Homeless, ' + str(mk_key)][state_key])
        ratio_th_dict[mk_key]['Federal CoC PIT'] = ratio(federal_coc_pit_data['Sheltered TH Homeless, ' + str(mk_key)][coc_key], federal_coc_pit_data['Overall Homeless, ' + str(mk_key)][coc_key])
        ratio_th_dict[mk_key]['MK PIT'] = float(mk_pit_data[str(mk_key)][47])
Federal CoC and Federal State has only one entry for DC State. We hardcoded the row number for each Federal DC CoC and Federal DC State in state_key and coc_key.
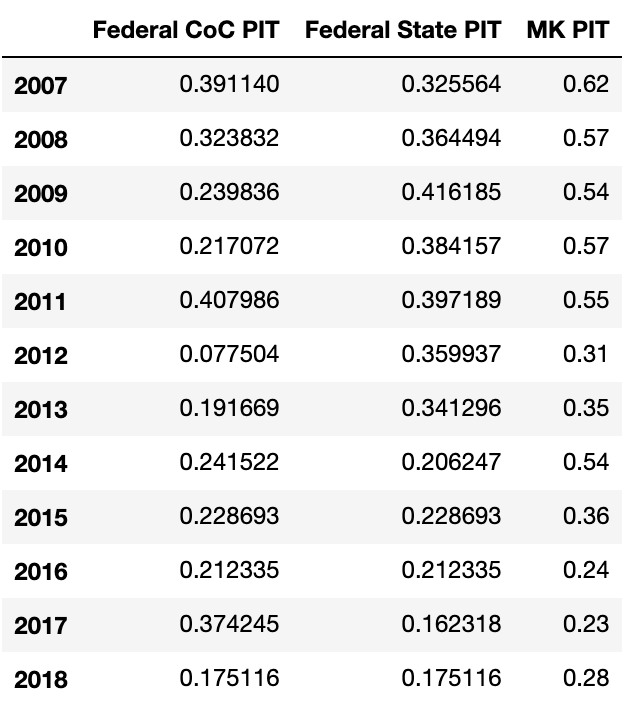
The data frame is shown below.

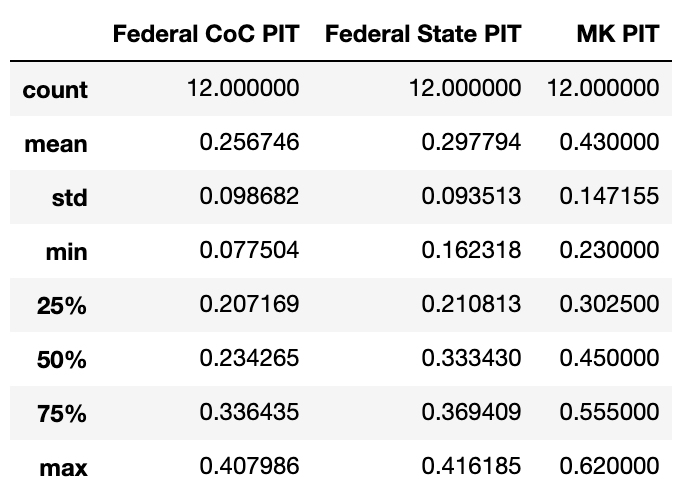
Below are descriptive statistics of the data.

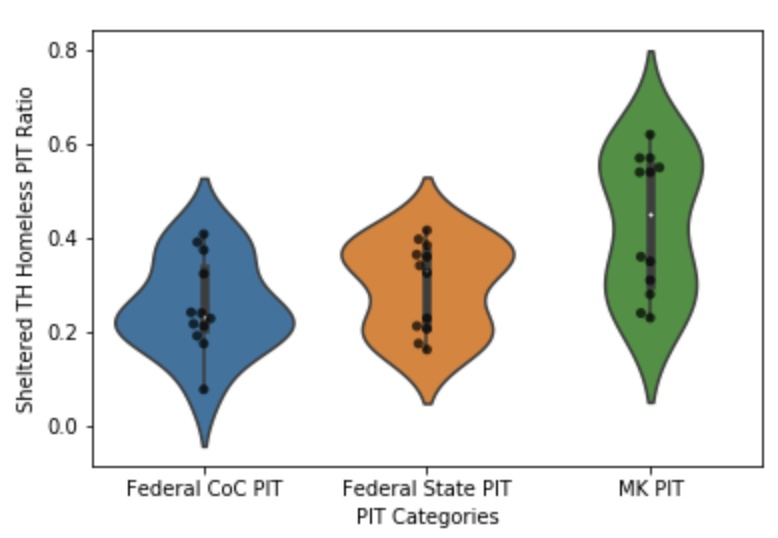
We can visualize the data as a violin plot.
sns.violinplot(x="PIT Categories", y="Sheltered TH Homeless PIT Ratio", data=pd.melt(ratio_th_pit_df, var_name='PIT Categories', value_name='Sheltered TH Homeless PIT Ratio'))
sns.swarmplot(x="PIT Categories", y="Sheltered TH Homeless PIT Ratio", data=pd.melt(ratio_th_pit_df, var_name='PIT Categories', value_name='Sheltered TH Homeless PIT Ratio'), color='k', alpha=0.7)

We can see MK PIT has a higher mean, min, and max in the descriptive statistics table. Furthermore, the violin plot shows that MK is having a bigger impact on sheltering homelessness.
3. Hypothesis Testing
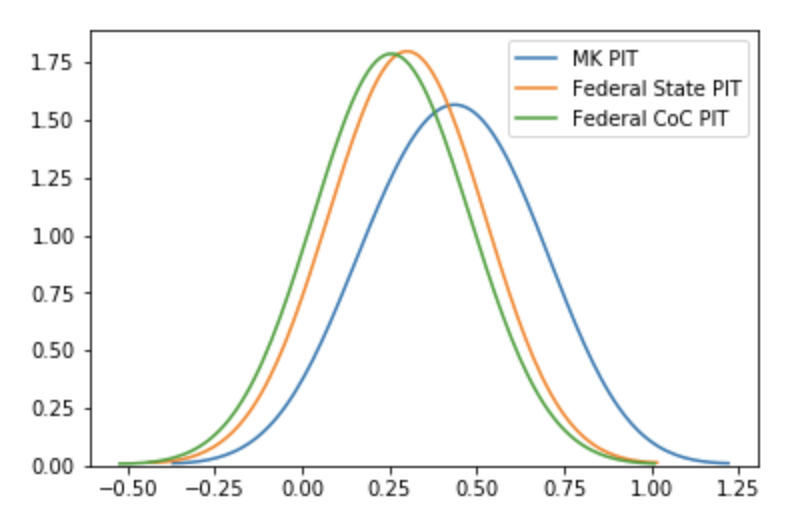
Regardless, this isn’t enough to justify that MK is impacting DC’s Homelessness efforts. MK_PIT is working on a smaller data set than Federal_CoC and Federal_State. We want to use hypothesis testing to see if MK_PIT is making an impact on Federal_CoC and Federal_State. To determine the hypothesis test, we’ll plot the Kernal Density Estimations to determine the distribution.
sns.kdeplot(ratio_th_pit_df['MK PIT'], bw=0.2)
sns.kdeplot(ratio_th_pit_df['Federal State PIT'], bw=0.2)
sns.kdeplot(ratio_th_pit_df['Federal CoC PIT'], bw=0.2)

The distributions show wide tails. We also have 12 elements per PIT data ( < 30 ), three different samples, and quantitative interval data. Based on this, we’ll conduct two 2-sample t tests: one with Federal State PIT and MK PIT, another with Federal CoC PIT and MK PIT. Confidence interval both at 95% (0.05 significance level - the probability of making a Type I error).
T-Test 1: Federal State and MK
Our null hypothesis for Federal State-MK test is that MK does not impact homeless efforts of Federal State. The results of the t-test are shown below.
t, p = stats.ttest_ind(ratio_th_pit_df['MK PIT'].tolist(), ratio_th_pit_df['Federal State PIT'].tolist(), None, False)
print('MK and Federal State PIT: T-stat=%.3f, p-val=%.3f' % (t, p))

Since the p-value is less than our significance level, we reject our null hypothesis. MK strongly impacts Federal State PIT data.
T-Test 2: Federal CoC and MK
Our null hypothesis for Federal CoC-MK test is that MK does not impact homeless efforts of Federal CoC. The results of the t-test are shown below.
t, p = stats.ttest_ind(ratio_th_pit_df['MK PIT'].tolist(), ratio_th_pit_df['Federal CoC PIT'].tolist(), None, False)
print('MK and Federal CoC PIT: T-stat=%.3f, p-val=%.3f' % (t, p))

Since the p-value is less than our significance level, we reject our null hypothesis. MK strongly impacts Federal CoC PIT data.
4. Conclusions
With visualizations and hypothesis testing, we have proved that MK has a huge effect on sheltering homeless in DC. It contributes significantly to Federal CoC and Federal State homeless efforts.
