Analyzing Tech Stocks of the Big 5 Tech Companies
September 2019 »This is the fifth project I completed as part of Metis Data Science Bootcamp.
Disclaimer: This is NOT investment advice. Stock markets are volatile and it’s hard to predict them.
Introduction
Back in 2015, my friends and I worked at Microsoft. We were awarded shares as part of our sign on bonus. I held onto my shares while my friends sold their stock to invest in Apple. Below is a stock price comparison of the two companies and how much the price jumped by in the 4 year span (2015-2019).

Microsoft jumped by 230% while Apple jumped by 91%. By remaining loyal to the company, I made more of a profit than my friends did.
But if you told me back in 2015 that Microsoft would be more valuable than Apple, I would have laughed at you. Apple was, and still is, a trendy company for millenials. People still buy the iPhones and many developers prefer Macbooks over PCs. It was interesting to see how a company that was an afterthought still rise up.
For this project, I sought to do a time series analysis on stocks of the big 5 tech companies: Microsoft, Amazon, Facebook, Apple, and Google. I want to predict which company will be a valuable investment in the long term, while also predicting the stock price in the short term.
Project Overview
This project is broken down into the following parts.
- Where do I get the stock data?
- How do I compare the true value of the companies for long term investment?
- How do I forecast the future based on historical stock data?
Data Extraction
I used TIINGO to fetch stock data from Jan 2015 to September 2019. However, I want to fetch the latest stock prices. The closing stock prices adjust every day, and I wanted to schedule a job to fetch that data and store it in an Amazon S3 bucket. I used Airflow to do so, and more details on how to instantiate this can be found in this post. Below is the ETL diagram for getting stock data.

Time Series Analysis
After getting the data, I went to predict two things
- The trend of market capitalization of a tech company
- The price of a tech stock
I used a variety of models to accomplish this
- ARMA
- ARIMA
- SARIMA
- Time Series Decomposition
- LSTMs
While LSTMs generated the best results, they were prone to overfitting and were not interpretable. I then sought the next best model: Time Series Decomposition. I used Facebook Prophet to help me decompose the time series.
Market Capitalization Trend
Below is what the current market capitalization graph looks like for the big 5 tech companies.

So what is market capitalization? Market capitalization represents the true value of the company. It is measured in stock price * shares issued. When comparing company values, we use this metric instead of stock price alone. Amazon has the highest stock price ($1794 at the time this was posted) and Microsoft has the lowest stock price ($142 at the time this was posted). But in the chart above, Amazon is 3rd in market cap value, whereas Microsoft is 1st in market cap value. Can we predict what the market cap trend will look like a year from now?
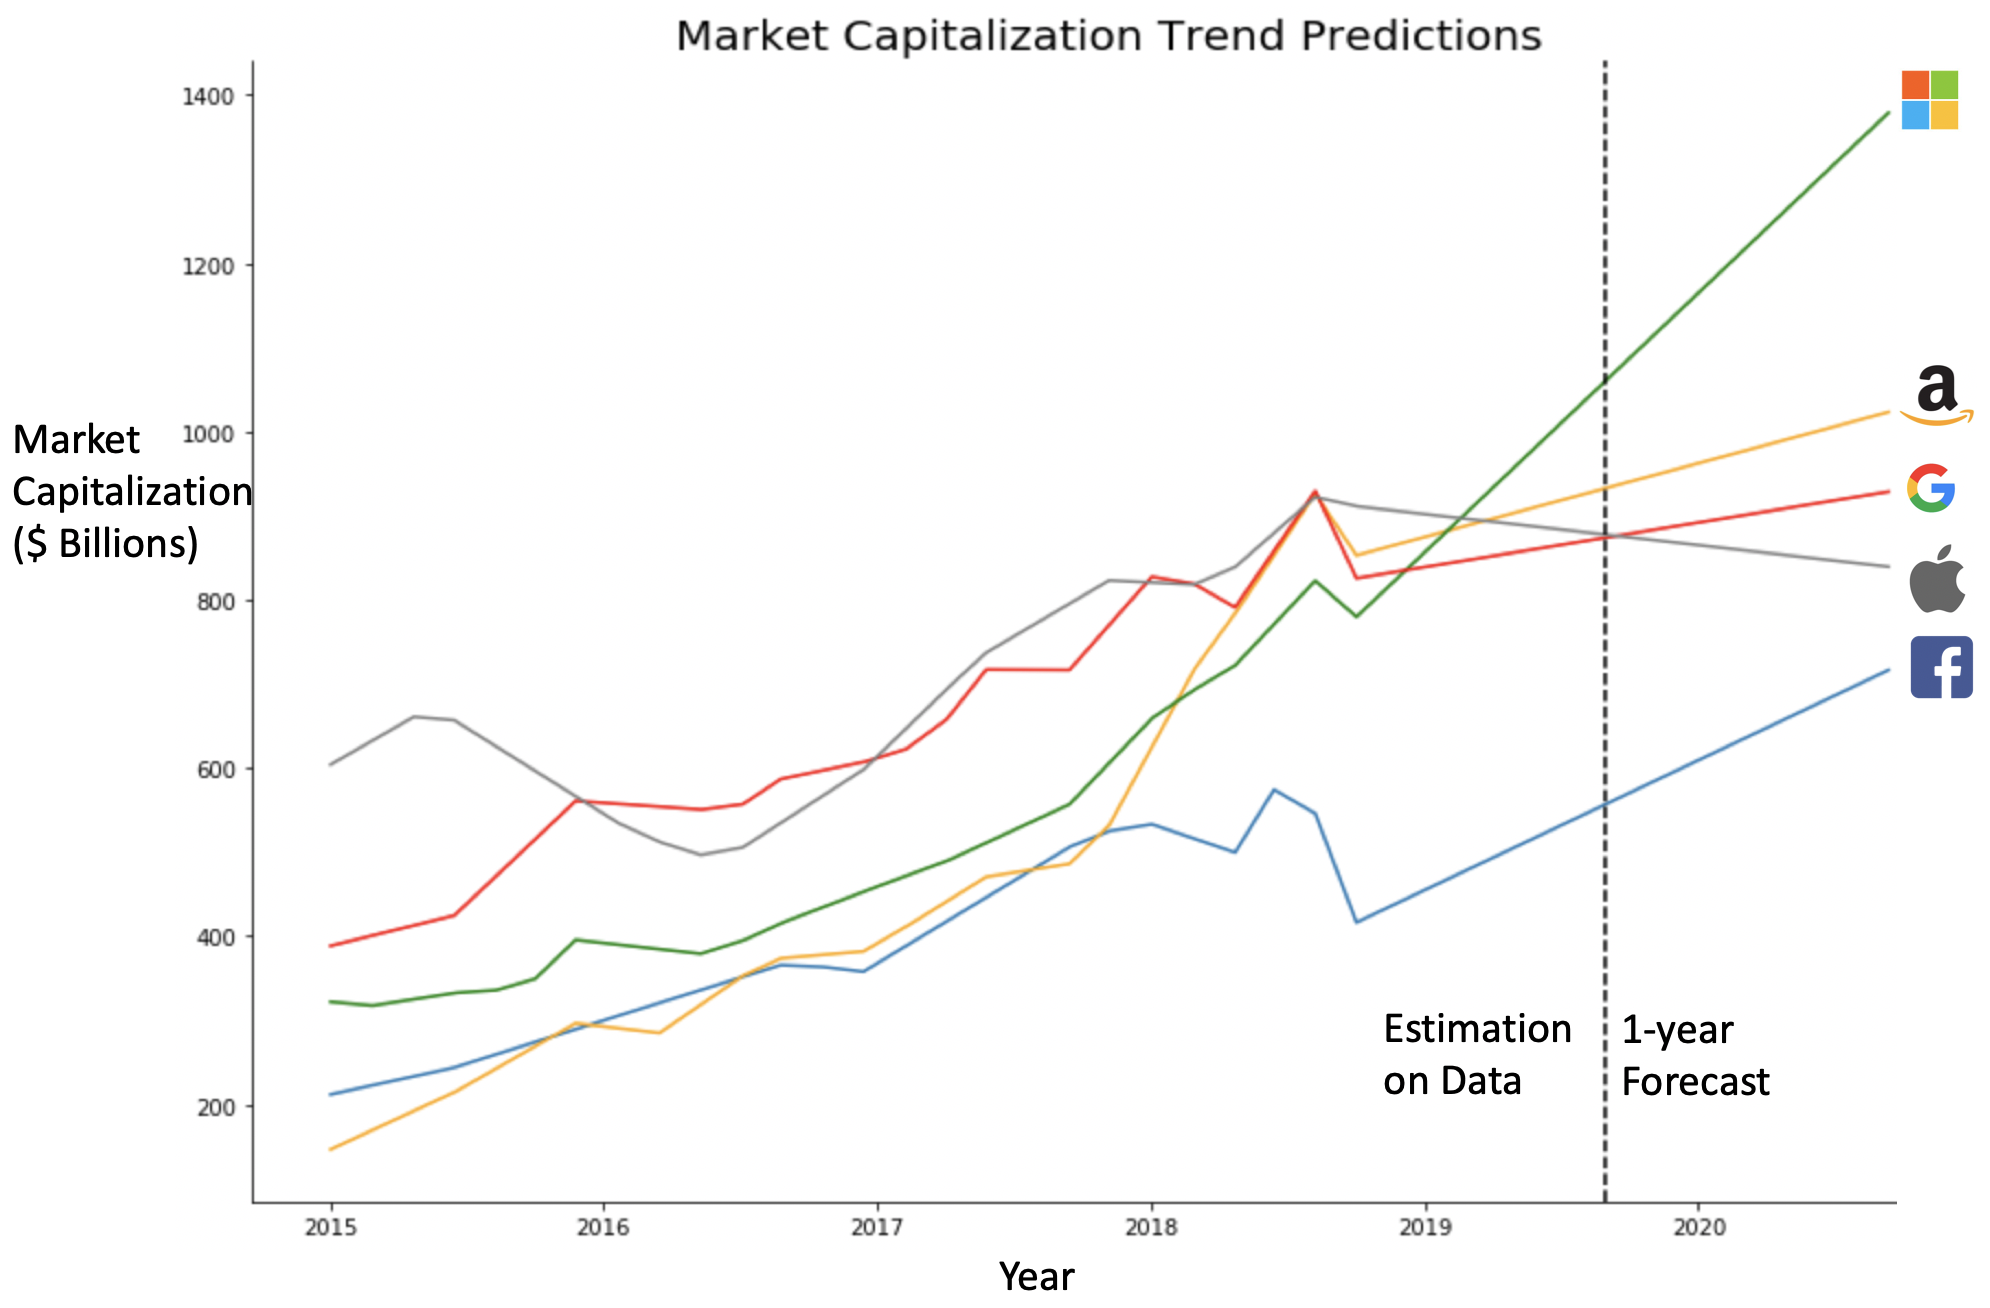
I used Facebook Prophet to decompose the market capitalizaiton time series into trend, seasonality, and residuals. I took the trend component and made a 1 year forecast from September 2019. Below are the results of my forecast.

It predicts that Facebook will recover from its Cambridge Analytica disaster, Apple will fall, Amazon will rise steadily, Google will rise steadily, and Microsoft will have a huge jump. This indicates that Microsot may be a viable long-term investment.
Stock Price Prediction
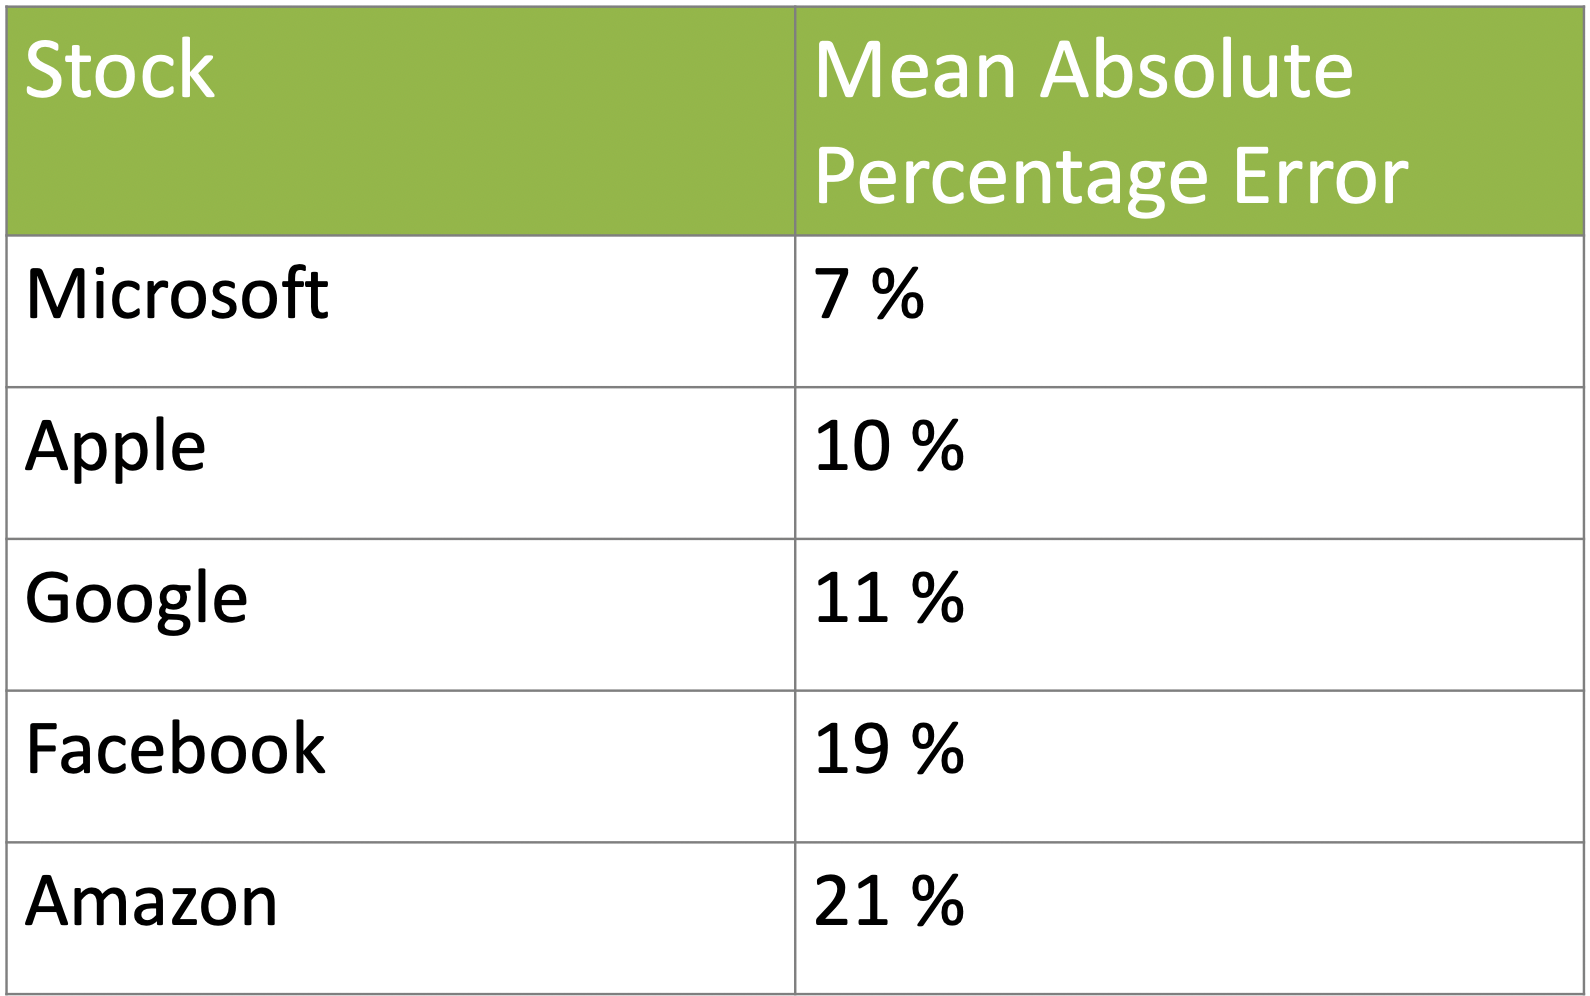
I wanted to see if I can make an in-sample prediction of the stock price of each company in a 45 day period. Below are my accuracy for the in-sample stock price models.

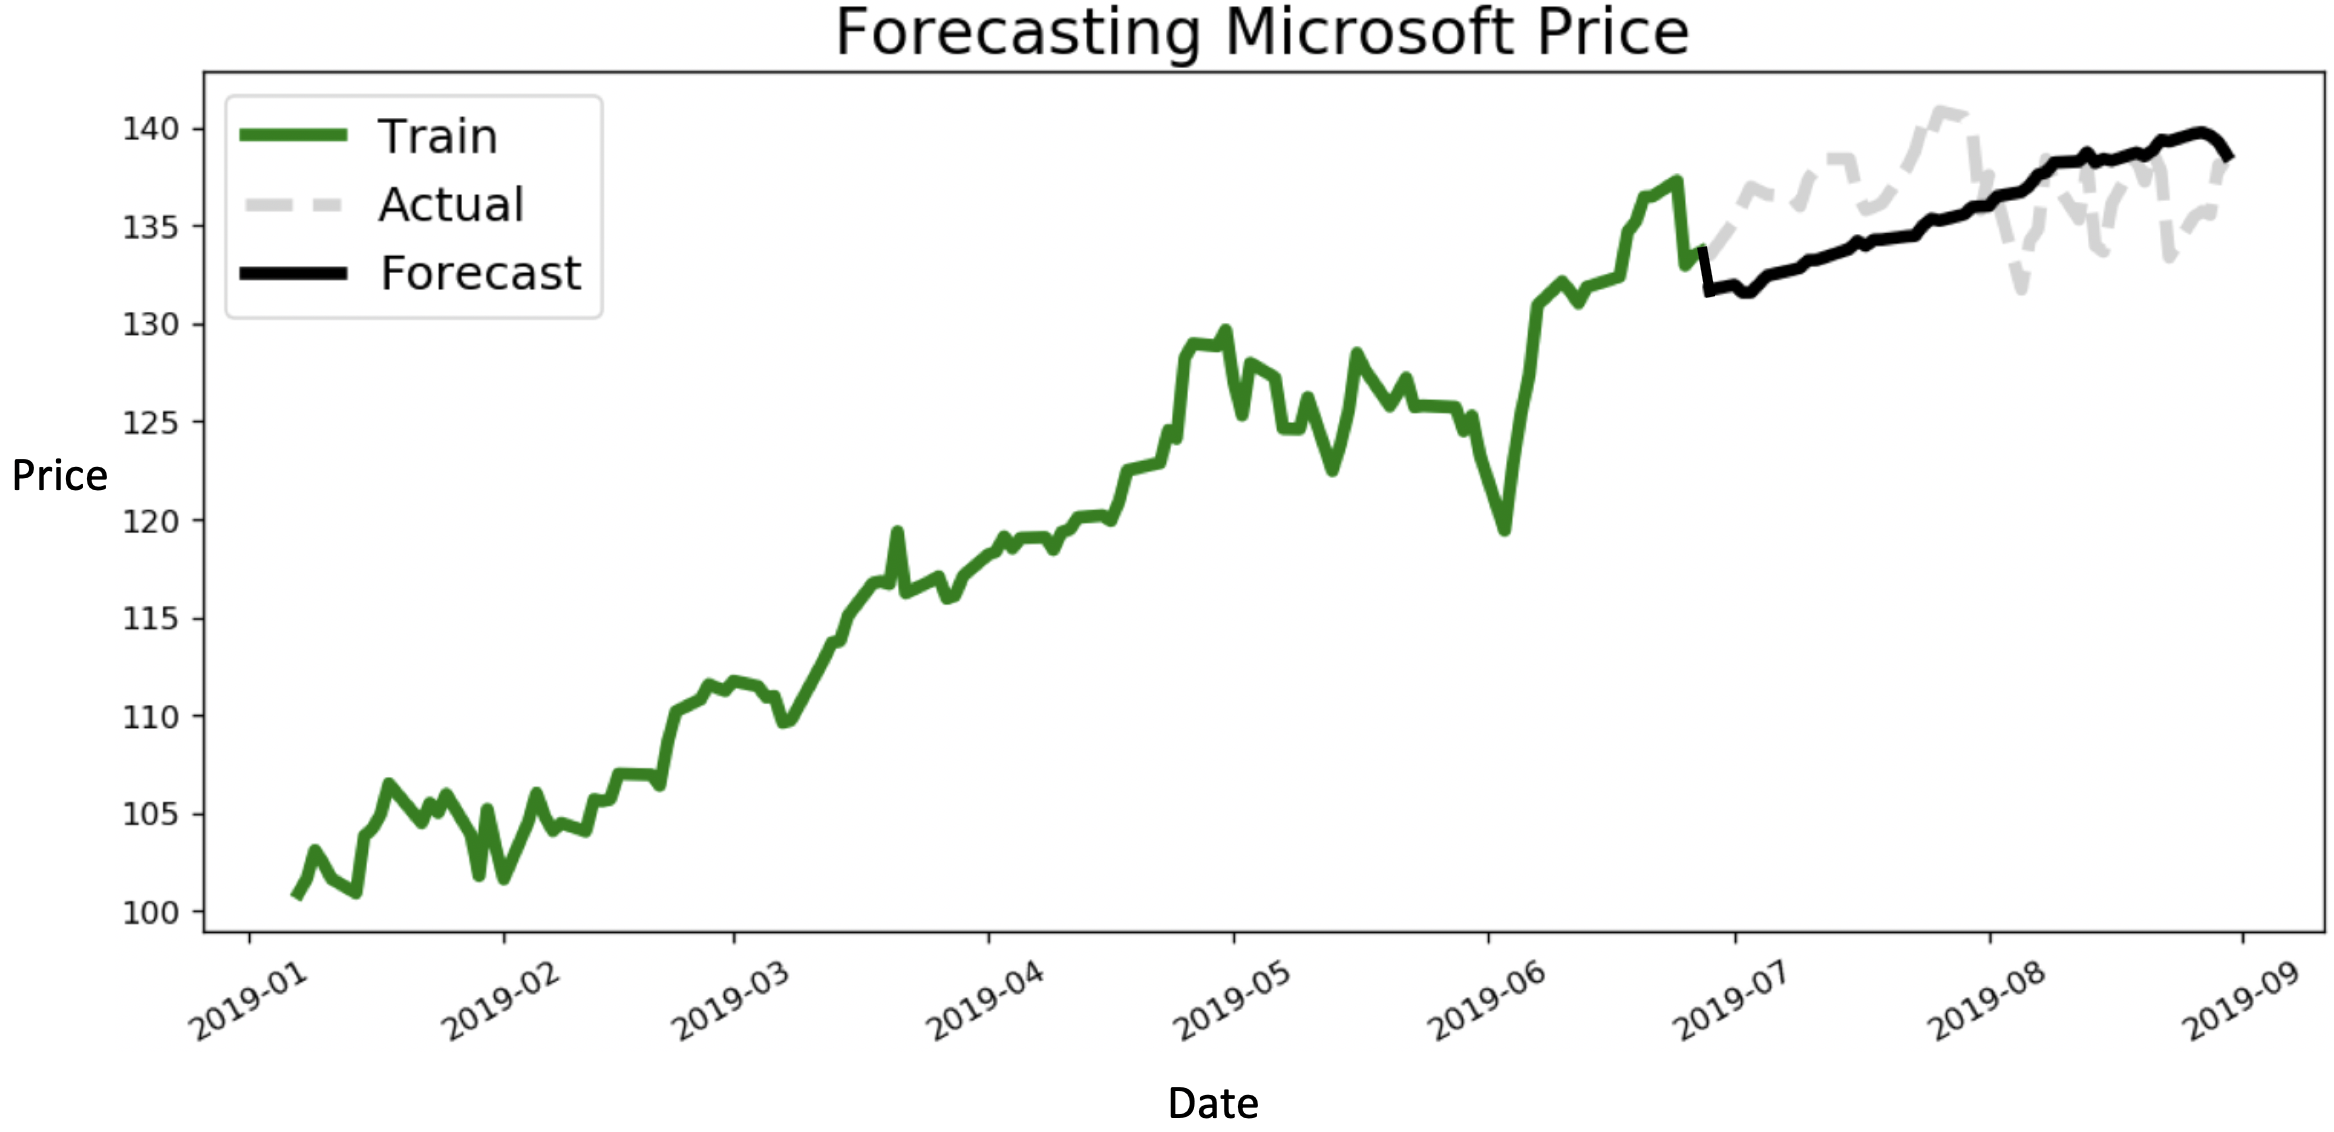
It’s hard to predict stock prices, so I was expecting my models to fall in the 15-25% Mean Absolute Percentage Error range. Reason for this is to account for volatility in the stock market that the models can’t predict (residuals/noise). I was surprised to find that Microsoft had an excellent accuracy score, and Apple and Google had decent scores. I decided to explore Microsoft’s stock price prediction. I built my 45 day forecast using trend and seasonality components of the decomposition model.

The predictions are pretty good.
Conclusions
Microsoft is a valuable stock for long term investment. And time series decomposition models are powerful for forecasting trends and prices.
